1. System Information
To display System Information web page, click Status > System Information
This page shows switch panel, CPU utilization, Memory utilization and other system current information. It also allows user to edit some system information.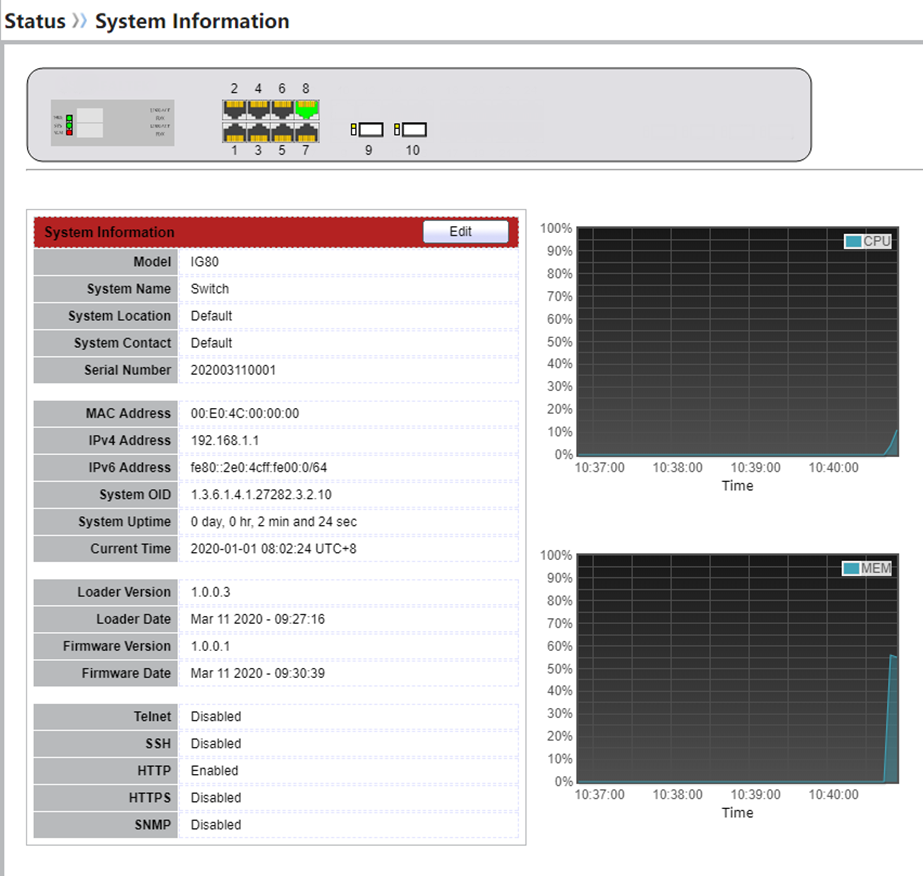
2. Logging Message
To view the logging messages stored on the RAM and Flash, click Status > Logging Message.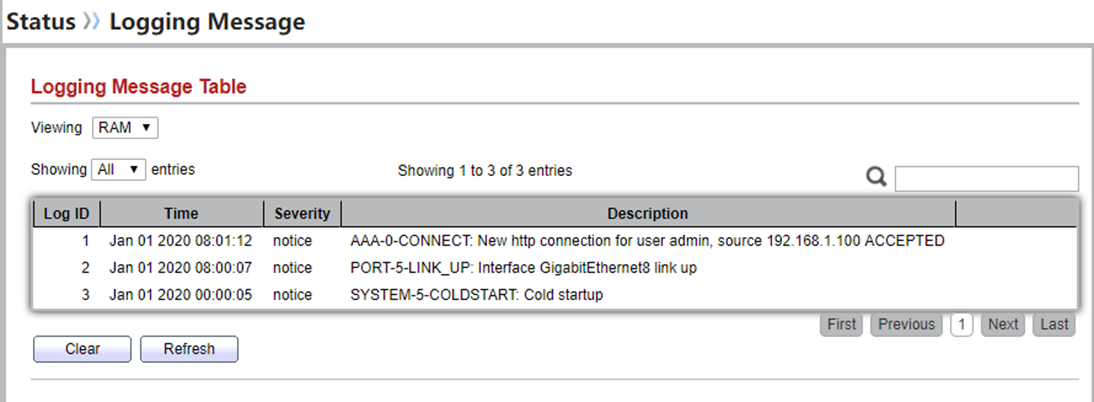
3. Statistics
To display Port Counters web page, click Status > Port > Statistics
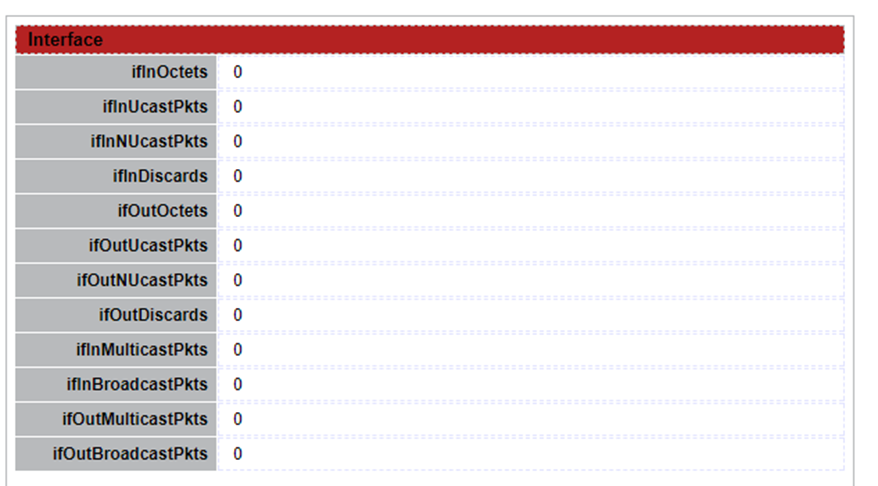
This page displays standard counters on network traffic form the Interfaces, Ethernet-like and RMON MIB. Interfaces and Ethernet-like counters display errors on the traffic passing through each port. RMON counters provide a total count of different frame types and sizes passing through each port. The “Clear” button will clear MIB counter of current selected port.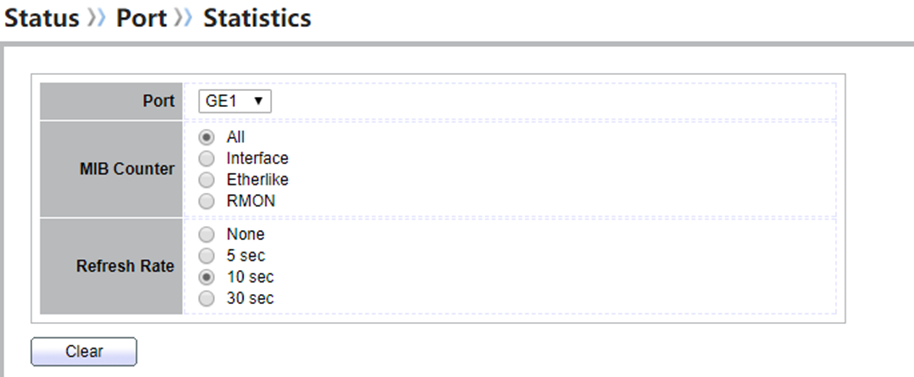
4. Error Disabled
To display the status of port error disabled, click Status > Port > Error Disabled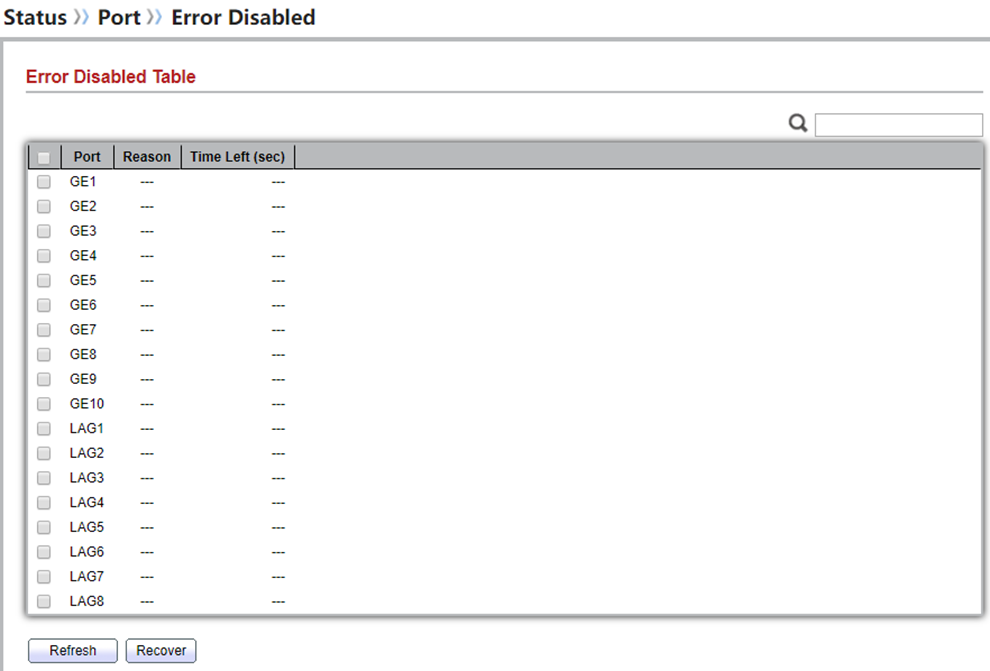
5. Bandwidth Utilization
To display Bandwidth Utilization web page, click Status > Port > Bandwidth Utilization
This page allow user to browse ports’ bandwidth utilization in real time. This page will refresh automatically in every refresh period.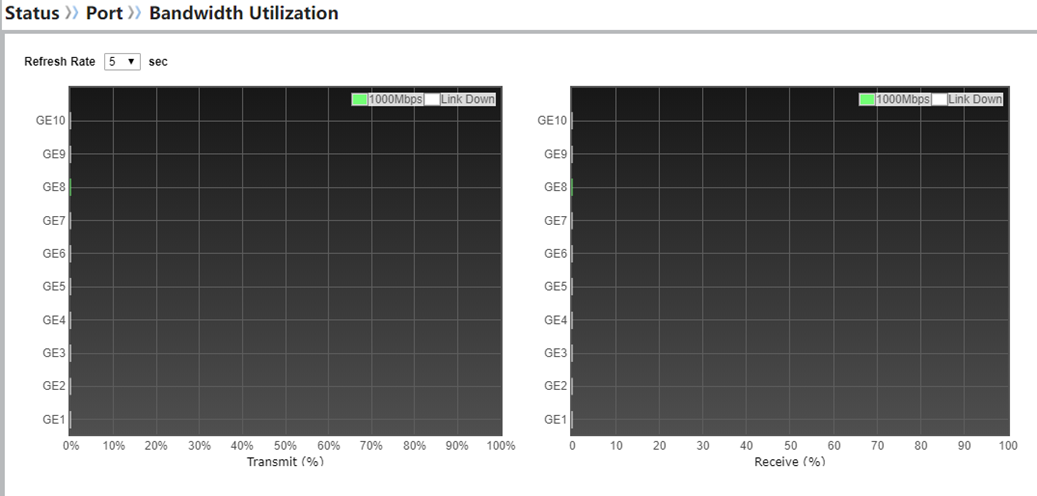
6.Link Aggregation**
to display Link Aggregation status web page, click Status > Link Aggregation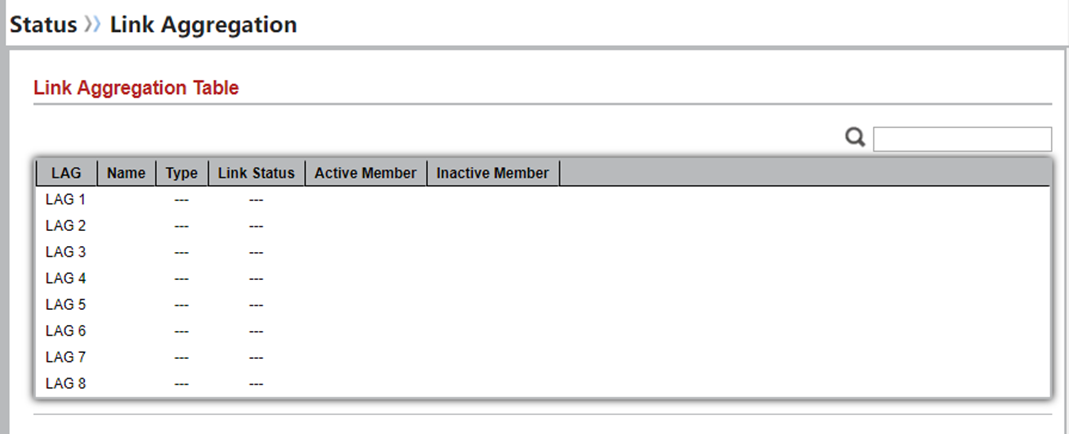
7. MAC Address Table
To display MAC Address Table status web page, click Status > MAC Address Table.
The MAC address table page displays all MAC address entries on the switch including static MAC address created by administrator or auto learned from hardware. The “Clear” button will clear all dynamic
entries and “Refresh” button will retrieve latest MAC address entries and show them on page.
最后编辑:todaair01 更新时间:2025-03-25 17:06
